
The Home Office last month released the England and Wales police workforce statistics. This always makes for interesting reading. Not just because police officer numbers are a political hot potato and of interest to forces, PCCs, police officers, the Federation, and the public alike. But also because it breaks down how Chief Officers have 43 ways of shaping their workforce mix and where they prioritise their resources, within the financial envelope afforded to them by local and national funding.
In Part 1, I gave you an overview of police officer numbers around all forces in the UK, including England, Wales, Police Scotland, PSNI, and others. I demonstrated whether it’s kept pace with the population and how that’s changed over the last 80 (yes, 80!) years in England and Wales.
In this follow-up, we’ll stay focused on the workforce statistics of England andWales (including the British Transport Police), with a deep dive exploring joiners and leavers. We’ll specifically look at more controversial issues, including:
- the rates and reasons officers are leaving, plus challenging the Home Office spin
- joiner rates and diversity
- the recent massive churn
- the growth in voluntary resignations
- age profile and service length following Uplift, and whether this is a problem (plus how forces are adapting and overcoming issues)
- how Chief Officers choose to resource their force, including the exponential growth of Professional Standards
I hope you find it informative and helpful!
Record Police Joiners with Uplift Final Year

The final year of Operation Uplift saw a record number of officers joining policing. Indeed, the overwhelming surge came in the final quarter of 2022/23, when it was otherwise looking like the 20,000 Uplift targets would be missed.
As shown above in my bespoke joiner/leaver graphic, there were over 16,000 full-time equivalent (FTE) police officer joiners. This is an unprecedented volume, smashing the 12,000 per year for the 3 years prior. As a percentage of all officers, this gives a ‘joiner rate’ of over 11% as shown in the green chart below.

The volume of leavers has also increased, with over 9,000 exiting policing last year, again a record. But we’ll cover more on that later.
For now, it’s of note that with Uplift concluded, there’s no sign of any further surges in recruitment. The funding instead seems has gone on the 7% pay award for police officers and staff. This means that the joiner rate of coming years will be to replenish leavers, assuming workforce strength is maintained, to around 6-7% each year.
Are New Joiners Increasing Police Diversity?
“The police are the public and the public are the police…” – Peelian Principle
Whatever the current diversity of policing, there are two main levers through which the proportion of police officers in diverse groups can be influenced:
- Joiners – The rates at which different groups join the police
- Leavers – How many from each group are leaving policing
Both levers impact the residual proportionality of officers left to serve the public. Of course, each can be broken down further to better understand the factors hindering or facilitating each. For example with joiners, HR departments often assess diversity rates throughout the steps of the recruitment process, from initial interest to application, interview, and then the actual appointment.
Many demographics are of interest, but there are 9 protected characteristics deemed most important for diversity monitoring. The Home Office record and report on just two of these when it comes to police workforce joiners and leavers:
- Race – Measured by proxy through one’s ethnicity (although the characteristic is of course far broader than skin colour)
- Sex – Male or female).
The Uplift programme and new entry routes were hailed as a means to massively influence policing diversity and representation, by increasing the diversity of police officers through the recruitment lever. Especially targeting and increasing the perpetually under-represented groups of female and minority ethnic officers.
It is of note that the Home Office counts only non-white ethnic minorities in their categorisation of what constitutes ‘black and minority ethnic’ (BAME). It (and forces locally) exclude white minority ethnic groups from BAME counts, such as Eastern European and Gypsy/Traveller. Incidentally, these groups make up over 8% of the working-age population, according to the 2021 Census.
Instead, these are lumped under the broad ‘White’ category. Indeed, the College of Policing and NPCC’s Police Race Action Plan controversially narrows this focus and attention-span for action further, seeking to “improve policing for black people”.
In that context, let’s see if Uplift has increased diversity in the way measured by forces and nationally.
Firstly, let’s look at the Race characteristic using the simplistic national categorisation, ‘White’ and ‘BAME’. I’ve included British Transport Police (BTP) to provide as fuller picture as possible from the Home Office published stats. Then I’ve laid out these as proportions on the simple chart below, excluding the ‘not known’ category…

This shows that for the last decade or more, the percent of officer joiners under the BAME category has remained stable, averaging 11%. The most recent year was therefore distinctly average, also at 11%. For context, 19% of the working-age population is from non-white minority ethnic groups. Therefore, Uplift appears not to have influenced ethnic diversity and policing still has some way to go.
For female officers, the situation is a little brighter. The last few years have seen a marked increase in the proportion of joiners, well above 40%. This continues an increasing, decade-long trend, after a reduction seen during the recruitment freezes of the ‘austerity years’.

For more about the challenges, barriers, and solutions relating to women in policing, see my four-part blog series.
Officer Leavers at Record Levels, Despite Home Office Spin

As shown above, the officer leaver rate hit a new high, approaching 7% of the workforce last year. This continues a long-term increasing trend, interrupted only by a reduction during 2020/21 (the main Covid year).
In its commentary, the Home Office recognises this unprecedented volume of leavers, being several thousand more than usual. However, the rationale given is little more than gaslighting, claiming simply that because there’s more officers, more officers leave…

What they try to hide from those uninterested in digging any deeper is that the increase comes from voluntary resignations. As I highlight below, these have grown exponentially in the last two years, both in volume and proportion.

Thankfully, this growth is coming from a low base. That means whilst it is not yet causing major problems for policing overall; there’s currently a few holes in the bucket. There will already be localised issues, with some forces and departments suffering more losses than others. Including for example the large portion of these who are resigning during probation (potentially relating to the issues around police degrees).
But if trends persist, within a couple of years officer retention will be like a sieve.
Why Are Officers Leaving?

So why exactly are officers leaving? The Home Office workforce publication gives some broad clues in terms of retirements vs. actual ‘wastage’ where people vote with their feet. As I demonstrate above, last year voluntary resignations have, overtaken retirements as the main reason officers leave the service. This is the first time it has done so.
The following chart looks at leavers per 100,000 officers. This gives comparable rates over time, ruling out the dubious/mistaken rationale of “more officers = more leavers” given in the Home Office statistical “analysis”. For a start, you can see that both resignations and retirements were on a steady, increasing trend over a decade or so. But in the last two years, voluntary resignations have shot up.

What the workforce statistics unfortunately don’t record is why officers are choosing to resign, which is the most interesting and most debated part of officer retention. On this matter, there’s currently only a patchwork of evidence to break this down further. For promotion candidates and other leaders wanting to make positive impacts on the situation, I pose the following as the main three reasons cited in recent times:
- Early resignation during probation: Whether because of dislike of the job and shift patterns, or in more recent times the intolerance towards more stringent PCDA academia, it’s no question that much of the increase in voluntary resignations can be attributed here. Certainly, the more relaxed recruitment processes used to cast the net far wider for Uplift may have also increased those recruited who soon find out the job was never for them.
- Falling out of love with the job: This is a rather broad-brush description, accounting for the wider context in which policing operates. But it includes officers feeling the time is right in terms of what they see as untenable public demands, untenable risk to them personally (be those physical assaults and/or the incessant lack of justice for those convicted, emotional stressors, or legal repercussions given the poor reputation of the IOPC et al.), or even disagreement with where the service is headed, conflicting with their personal values and why they joined.
- Salary, particularly for the first few years: Police officer salary, particularly for the first few years, has been a bone of contention for a long time. However, this may soon change, given the recent inflation-busting award for new starters and the 7% for everyone else in 2023.
But as with any workplace, other prominent reasons are the result of poor relationships with or treatment from their management and/or colleagues. The Casey Review highlighted many shocking examples, but the reasons need not be so widespread or extreme. Basic poor management was the number one reason in a small-scale study of one medium-sized force.
To complete the evidence patchwork, other surveys by the Federation have previously emphasised the pressures of the job, salary, stress, general poor morale, and even concerns around Covid vaccination.
Rank Success exists to support aspiring leaders, levelling the playing field while helping policing to provide better leadership and so enhance the working environment. In addition, with officers able to excel in the face of otherwise daunting promotion processes, individuals aiming for career progression are retained in policing.
Unfortunately it would seem, no tangible insights into leaver’s true reasons will be gleaned until force HR departments conduct meaningful exit interviews. Such interviews with the nearly 5,000 (and growing) voluntary leavers would truly help understand and quantify the particular local issues.
There’s even a ready-made and simple guide on doing exit interviews, for forces out there lacking knowledge on how to do it, or are locked in a quagmire of inertia and bureaucracy.
Until then, decision-makers must operate in the grey, taking heed of the patchy and anecdotal evidence when it comes to attempting to reduce voluntary wastage.
To complete the picture on overall officer leaver reasons, there are two more reasons officers leave in service: conduct/performance matters and death in service. The chart below shows both, again normalised to match the changes in the overall police workforce.

The rate of dismissals (or required to resign / resign during investigation) has varied greatly since 2006/07. It increased over a decade to a peak of 235 per 100,000 officers in 2017, but has since reduced.
Death in service is thankfully the smallest category, last year equating to 0.05% of all officers (75 individuals last year). The risks facing police officers are well-documented, that’s without monumental force blunders unnecessarily increasing the risk further.
Death in service figures show a gradually declining trend from 2007-2012, settling thereafter at around 50 per 100,000 officers. The last few years of continuing the completely flat trend may also offer reassurance to multiple parties in relation to Covid. Both to those concerned about the disease itself and/or those concerned about any ill-effects posed by the new vaccines.
Firstly, there’s clearly no evidence of any increased mortality coinciding with the timing of Covid itself, despite vociferous concerns raised by the Police Federation at the time of vaccine prioritisation. Conversely, many are concerned by the potential collateral damage caused by the vaccines themselves. Thankfully again, there’s no apparent signal of increased mortality among police officers coinciding with the last couple of years, in which the vaccines were rolled out.
Forces have locally recorded sickness absence relating to both these aspects of the pandemic, sickness from Covid plus also sickness recorded as related to the Covid vaccine side effects. But clearly (and thankfully) there’s no apparent translation of such sickness into a spike in overall mortality of police officers in the last few years to March 2023. The same story occurs when looking at Police Staff.
In case you’re wondering whether any of this has had any impact in recent years on ill-health retirements… there’s no trend or apparent signal there either. ‘Medical retirements’ (as the Home Office categorise it) for officers have been steady in the last four years, and at around half the rate seen between 2012-2017.
I hope you find this information as reassuring as I have for the thin blue line.
How Do Female and BAME Leavers Compare?
Diversity is a subject touching every aspect of policing, leadership, and of course your promotion process. So let’s now check in with any disparities between different demographics of leavers, which may warrant further investigation in case of any discriminatory processes or practices.
As mentioned before, forces only count 2 of the 9 protected characteristics when it comes to officer leavers. And as the saying goes, “what gets counted gets done”. So don’t forget the other, equally-protected characteristics in your leadership decision-making!

I compare above the overall leaver rates against that for the two recorded under-represented groups. Historically, both female and BAME officers have left at rates lower than the average. This is mainly because retirements used to be the main reason for leaving, whereby those officers coming up to retirement age were far less represented in the past, so make up a smaller proportion when leaving now.
However, in the last two years, the uptick seen among the BAME officer cohort has exceeded the leaver rates seen elsewhere. That isn’t relating to retirement, but voluntary resignations. Below shows the significant uptick in headcount of those officers voluntarily leaving policing in the last two years.

Digging further, half of these ‘BAME’ voluntary resignations last year were from those who identify as Asian or Asian British. This group isn’t covered by the Police Race Action Plan and related retention measures. So why might this be? As a leader, how might you create a more inclusive environment and/or better support such groups to encourage retention and stem this apparent flow?
On the female characteristic, what are you doing to make policing a more inclusive environment for women? How are you helping to break down some of the challenges and barriers women face?
All of these are great practice questions to ask yourself, as part of your ongoing leadership CPD and/or ahead of any promotion opportunity.
We Would Never Break the Churn?
Combining leavers and joiners gives us a small impression of the overall ‘churn’ within policing. That is, those going completely in and out of this increasingly fast revolving door of a career as a cop.
The joiner and leaver rates together give us around 18% of overall ‘churn’. That figure combines the challenge of training up new inexperienced officers, while also losing a significant number of experienced ones, through (mainly) retirements and resignations each year.
Should policing accept the ‘new normal’ of voluntary resignations? This need not continue at these rates. Recent pay awards will surely aid retention, while the pending reintroduction of non-degree entry route promising less academia will no doubt help from 2024, given controversies surrounding the PCDA.
On the entry-route situation, I can even foresee universities being squeezed out of the market, as forces are no longer forced to work with them given that the College of Policing have caved to pressure to reintroduce non-degree entry routes. Savvy finance departments (those that exist to support force decision-making, rather than drive it) may choose to simply ‘write off’ the 0.5% apprentice levy, in favour of better retention and more inclusive non-degree entry routes, saving costs and hassle for the longer term.
Bear in mind however, far more churn occurs locally, as Chief Officers decide where they place their resources. Whether that’s in relation to postings or promotions, the ‘churning effects’ felt are just as strong as if those colleagues had left the force entirely.
Regular gaps are created in the wake of people being constantly transferred and promoted to other LPAs or functions. Given the entire organisation is sometimes likened to an oil tanker (e.g. see Turn the Ship Around), this internal local turbulence could be thought of as like a thousand speedboats buzzing around.
This constant swirl is particularly felt more on the operational side of policing, where things are far more fluid. For example, local surveys have indicated cops are lucky if they have the same line manager for over 12 months. There’s also the promotion ‘butterflies’, who land for a short while, before taking off again rather too quickly for those left behind.
Neither situation gives enough time to deliver any meaningful leadership contribution, stability or certainty for their people, working against a background of significant changes and uncertainty. People in fact need some sort of anchor in this swirling sea of change.
Length of Service and Growing Inexperience?

The Federation and many officers alike have criticised the sudden surge in Uplift and the challenges it presents. As outlined in Part 1, the speed and scale of recent growth in England and Wales officer numbers is unprecedented in 80 years.
It turns out that articles predicting Uplift would cause a third of officers to have less than 3 years experience got their maths rather wrong. Yes, there’s more officers now in their early part of their career following the recent few years surge in recruitment. But that has actually risen from 27% having less than 5 years of experience in 2019/20, to 36% in 2022/23.
While the proportion of those younger in service has naturally increased with Uplift, the proportion deemed far more experienced has reduced. It’s hard to put a figure on what is ‘enough’ experience for policing, but the most cited is 5 years. So policing has gone from 73% to 64% of its officers having at least 5 years’ experience, over the period of Uplift. While the proportion has gone down however, there has been no actual reduction in the volume of officers with over 5 years’ experience, staying around 96,000 FTE.
But while the national and local governments determine the overall funding for a force, it is the Chief Officers who decide how many officers, staff, PCSOs, and so on they use that money for, and where they choose to place them operationally (or otherwise).
For example, the contrast in the charts below are fascinating. The first depicts the great variation in how forces balanced their books using officer numbers, during the years of ‘austerity’ upon their central government funding. It tracks change in police officer FTE from the peak of 2009/10 to before Uplift started in 2018/19. Several clearly managed things without so severely decimating their officer strength compared to others; choosing instead to make more cuts elsewhere.

For example, several forces had minimal long-term change to their officer strength like Surrey, Cambridgeshire, Norfolk, and Dyfed-Powys. Others, like Cleveland, Hampshire, Staffordshire, Northumbria, and Durham instead chose to disproportionately target police officer numbers to meet their required cost savings, reducing their officer strength by over a quarter (far higher than the proportion of overall cost needing to be saved).
For context and to complete the picture now that Uplift has now concluded, here’s how forces have mostly ‘bounced back’ in terms of officer numbers in the last 4 years. The variation is less, reflecting more whether forces were able or not to achieve their targeted Uplift recruitment numbers since budget increases were closely tied to that. Most were generally in line with the national increase of 20%.

There is clearly great disparity in how different forces make their operational decisions to prioritise their resources. From the macro level of how finances translate to their overall workforce profile, down to the micro level of where exactly they then place those resources and what police work those people are doing.
As a recent example of the micro level, ACC Katy Barrow-Grint outlined in our recent podcast that 80% of Thames Valley Police’s response function have under 2 years’ service. However, across England and Wales, the Home Office report that 17% of all officers have under 2 years’ service. This alludes to where forces are choosing to post their less experienced officers, with TVP clearly choosing to utilise most of their more experienced officers across other functions.
Improvise, Adapt… and Overcome?
With large influxes of new joiners across most forces, there are certainly some different ways of absorbing new officers. Questions include:
- How are thousands of new student officers being effectively supported with induction, development, and meaningful support with on-the-job learning?
- Where do you suddenly get enough experienced tutor constables from and did forces plan effectively for this?
- How do you ensure enough time is being spent with new joiners, to deliver the bespoke support and guidance they need as individuals to meet the standards required?
To answer some of these questions, I spoke in confidence with several response officers at Constable, Sergeant, and Inspector level to obtain some insights. The result is a small snapshot of the wider picture, but some interesting insights are gained, as I summarise the insights below…
It seems forces are doing their best. This includes a ‘needs must’ or ‘mix and match’ approach. For example, to make things work, officers are being posted straight to police response teams from the outset, without the opportunity to learn, grow and develop in slower time with support by assigned and dedicated officers. In any case, there’s simply nowhere near enough trained tutors to accommodate them anyway, so newcomers are being inducted for their first few weeks of their careers on response units. Not perfect by any means, but needs must.
In some cases, response cops with 3+ years’ service are classed as ‘experienced’ (maybe they are!) and now performing the role of ‘resilience tutors’. A day’s training on “how to speak to people and how to deliver feedback” and it seems you’re good to go! Recently retired cops with an L&D background might be wincing at this point.
Incentive payments (circa £150 per new joiner) are a feature for those who ‘volunteer’ to help get a student officer through their important initial weeks on patrol. That’s before compiling portfolios to evidence and justify their Independent Patrol Status (IPS, i.e. legally able to be deployed alone).
Unsurprisingly, there is a dropout rate of individuals who decide policing is not for them. Initial weeks in the deep end on a busy city centre response unit is a harsh introduction to the job. It’s a pressured environment, and one where ‘resilience tutors’ can’t always dedicate the time they would like to fully support new officers. Ergo, new officers arrive on response raw, inexperienced, and/or without the confidence boost or time for reflection to apply their initial learning. Yet they are deemed ‘fully fledged’ by the force.
To confound the situation, and when their resilience tutors are not available (being run from pillar to post), brand new student officers (who aren’t allowed in public unsupervised) get deployed with young-in-service officers not out of probation themselves.
Clearly these concerns expressed all come down to new and student officers not getting the attention they deserve, primarily because of the pace and demands of response policing. Training and CPD, despite the best will in the world, are taking second or third place. While people are doing their best to accommodate the numbers (without the resources to effectively support them all), “good enough, is good to go” seemed to be the aiming point.
So what does that mean? “What kind of concerns are there now?” I asked. Here’s some of the gist of what impacts this has, which may resonate with others around the country:
- “Unwillingness, inability or lack of skill to provide honest feedback on behaviour and standards. A tutor constable course used to be 4 weeks – they get one day. There’s pressure to get the new officers in, so apart from those who drop out most will get through. That’s the kind of thing that stores up problems a couple of years down the line.”
- “Tutors writing up one incident, being dispatched straight to another before they are finished; always playing catch up, regularly going without meal breaks to meet demand. Yet they’re expected somehow to also supervise a colleague, who is probably full of questions, but there’s not the time to answer them, explain or demonstrate.” Debriefs planned for end of a shift with good intent are being postponed to the next day, in which “you are straight into it again. It’s exhausting and frustrating.”
- “With public confidence at a low point, and expectations of police high, it’s good to get the numbers coming back, but you can’t escape the feeling that we are lowering standards to get new recruits in at scale.”
- “Honest feedback is not always provided at the time required, because many officer’s know it’s an uphill battle to ‘push it’. You then become ‘the problem’ yourself, because there’s pressure to get the volume of new officers through and everything is questioned.”
- “This may be a perfect storm, some officers joining now, will be the ‘problem children” of the future’.
Does this qualitative snapshot resonate with your force? Are things ‘just about’ working, with potential problems being stored up for the future? Is response/patrol similarly down the pecking order of prioritisation in terms of experienced officer resource in your force?
More importantly, as an aspiring police leader, how will you seek to help improve this service to the public?
PSD Bucks the Trend…
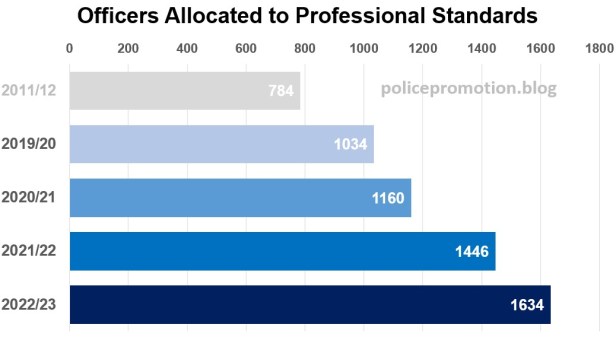
Continuing this theme of local prioritisation of resources, an interesting comparison is to look at Professional Standards Department (PSD) allocations. Professional standards are a constant topical subject in policing, not least in recent years of scandals and scrutiny.
Judging by the size of departments, this is clearly a major priority for forces and their Chief Officer decision makers. There’s been massive growth in PSD officer strength across England and Wales, even completely bucking the overall trend of decline between 2010-2019. Note also, this is just focusing on the police officer side of things; PSD also contains plenty of civilian staff, similarly growing through the years.
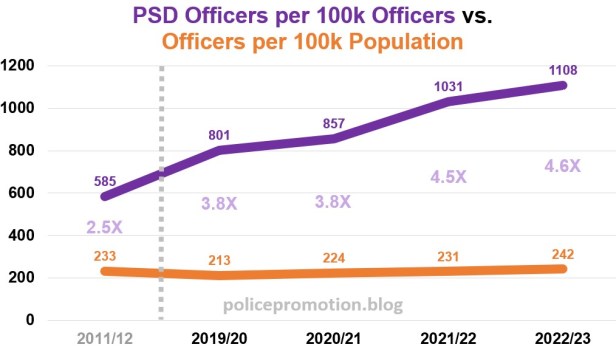
It can be said that while it’s the police who police the public, PSD are the police policing the police. With this in mind, I compare below the rates of police officers within PSD per 100,000 officers, against overall officer numbers per 100,000 population. This allows a comparison of the rates at which the police are policing themselves, compared to policing the public.
While it’s right that policing is held to higher standards, the results may be eye-opening for many. Prior to the real impacts of austerity, Chief Officers chose to place around 0.5% of their available officers into professional standards functions. This has risen to nearly double by 2023, possibly indicating their desire for increased scrutiny and investigative capacity when it comes to officer conduct.
Given additional scrutiny and findings like the Casey Review, it may be little wonder why Chief Officers are choosing to place more of their workforce in these back-office functions. However, there surely must be a balance. Coming back to voluntary resignations, the additional pressure and scrutiny may well be one of the factors driving officers from the front line.
Meanwhile, it seems the accelerated growth will only continue, as for example the Met Police accelerate plans to root out offenders. So expect to also see more leavers via dismissals in the coming years.
Police Officer Age Profile: Young at Start?

Much furore has persisted over officer age and experience, often verging on ageism. The ageism bit comes into play when the following prejudicial (and somewhat cynical) assumption is uniformly applied: Young = less police experience = worse cop.
However, the factors at play are far more complex. It’s too easy to dismiss or overlook enthusiastic, energetic young officers seeking to learn and do the right thing, including those just a few years in service. There are also of course cynical ‘old sweats’, pining for the good-old-days, with their focus elsewhere, maybe on a glidepath to retirement and the next chapter in their own lives. Who would you prefer as your crewmate?
But arguments aside, when it comes to the cold, hard figures, the growth in those aged 18-25 has been relatively modest compared to media hype. Officers aged 18-25 have grown to around 13% of the workforce, just 5% higher than the 8% seen in 2007. It would have been higher in prior phases of police recruitment drives. If anything, in recent years this has actually improved diversity, given it is now more proportionate to the working-age population for this equally (albeit less emphasised) protected characteristic.
During the recent austerity years, there was little to no recruitment. This therefore drastically reduced the proportion of officers in the youngest age bracket, especially between 2010-2018. Certainly comparing to this more recent time, it would no doubt seem to colleagues that ‘officers are getting younger’.
Given that Uplift has now finished, it is unlikely recruitment will be surging again in the coming years. This will inevitably stabilise the proportion of 18-25s next year, then gradually reduce the proportion down to 10% within a few more years as ‘normal’ recruitment / wastage takes hold.
The youthful appearance of many new officers is an age-old phenomenon. It’s an observation those who have the privilege of having reached or surpassed middle-age tend to recognise. And the older you get? The younger those cops might seem seem to look. It’s a matter of perspective. Here’s a picture of me when I joined at the age of 23; looking back now, even I can’t believe how young I looked!

“Youth is wasted on the young” is an old adage, particularly on days when a knee gives out or perhaps your back starts twinging. A 16th century Frenchman, Henri Estienne, had a more inclusive way of saying things:
“Si jeunesse savoit; si vieillesse pouvoit” (roughly: “If only youth had the knowledge; if old age had the strength”).
The best leaders do genuinely care. They are self-aware, conscious they are building their leadership legacy every day, despite the very real and varied challenges they and their teams face, and sometimes, especially when believing as they may do, that senior leaders may not be getting things right. Nevertheless, true leaders will ensure all new recruits are welcomed with an open heart and mind, expecting their own teams to freely share accumulated knowledge and expertise.
All were once at the point of the ‘ink still wet’ on ID cards, and that’s the point every new joiner deserves the best support possible. There’s a minefield of potential pitfalls beyond that, until officers find their feet, gain confidence, and meet the standards. Good leaders and those who aspire to formal leadership positions have that in mind and make the best of the situation. Does this describe you?
In closing, consider the following forward-facing promotion board question for the Inspector level:
“Following Uplift, how will you mitigate the challenges of inexperience on your response teams to ensure consistently good public service is achieved?”
I hope you’ve found this deep-dive on joiners, leavers, diversity, and other such workforce data helpful. Whether that’s just a general interest in how policing looks or to familiarise yourself with the issues facing policing as part of your leadership CPD. Let me know in the comments your thoughts on the changing demographics of policing, and I’ll be back soon with some more insights into the police officer workforce profile.
Kind Regards, Steve

Want to go further right now? Hit the ground running with your promotion preparation. Get your personal digital promotion toolkit, and/or my Police Promotion Masterclass. You can also contact me to arrange personal coaching support. If you first want to explore completely free content, I have a collection of videos, eGuides, a podcast.